Microsoft Dynamics NAV
Complement your ERP solution by unleashing insights hidden in unstructured data. With a sound BI investment, you can hone operational performance, sharpen customer-centricity, and focus on developing new competencies.

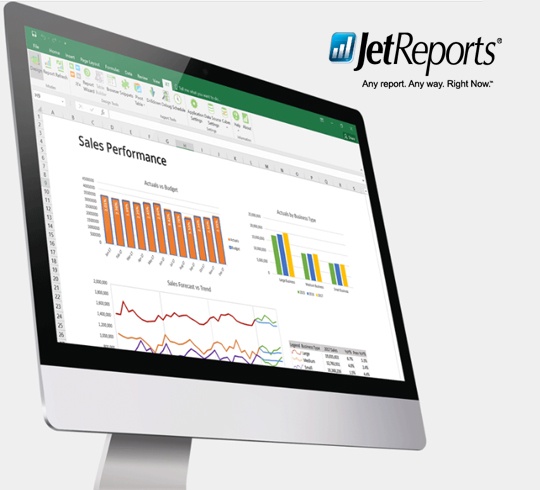
JET REPORTS: Instant Data-Driven Decisions

Create high-impact Excel reports from any point in Microsoft Dynamics NAV – even add-on and third-party modules. Or use Jet Enterprise for BI, and turn data into insightful reports and dashboards.
- Instant Access from Excel
Access real-time data directly from your Microsoft Dynamics NAV database in Excel. - Fast and Easy Analysis
Easily drag and drop data to analyse metrics within Excel’s familiarity. - Robust End-to-End Solution
Instantly view accurate and organised data in Excel, the Web, Mobile or anywhere.
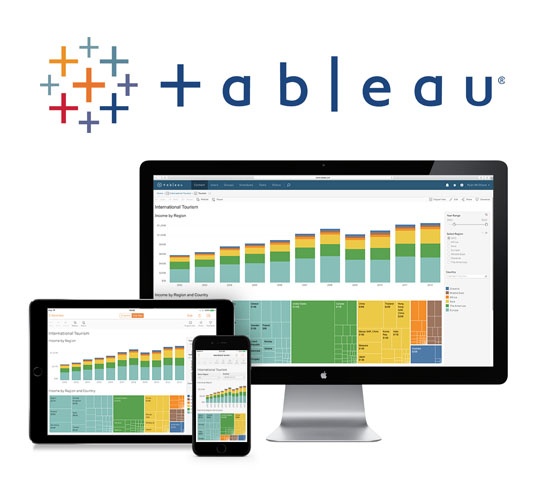
TABLEAU: Make Your Data Make An Impact
The leader in Gartner’s Magic Quadrant for BI and Analytics for several years, Tableau transforms big data into gorgeous, interactive dashboards for instantaneous insights.
- Rapid Analysis of Big Data
Analyses and visualises millions of rows of data in seconds, so you work efficiently with large data sets. - Excellent User Interface and Experience
Highly intuitive, and designed using data and visualisation best practices. - Easy Connection and Integration
Connects not just to Excel, but also to almost any database systems — databases, cubes and data warehouses.

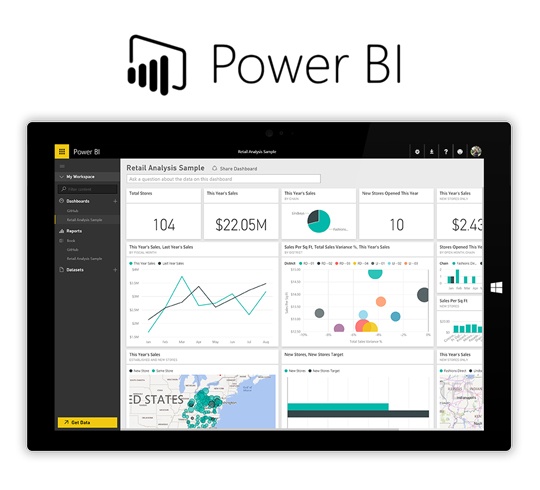
POWER BI: Bring Your Data To Life

Monitor your business and get the answers you want quickly. Available on every device, Power BI is the analytics tool for data visualisation and sharing insights.
- Part of the Microsoft Ecosystem
Seamlessly integrates with and leverages on other Microsoft products. Users will appreciate the familiar Microsoft look-and-feel. - Connects with Multiple Services
Includes Jet Reports, Excel, CRM and ERP software, web-service APIs like Salesforce, and even Zendesk, Twilo etc. - Real-time, 360-degree View of Business
Easily explore the data behind dashboards in one click, and access it on-the-go for even greater efficiency.


